Which airline problems should be fixed first?
14,640 tweets that customers sent to six US airlines in February 2015. I cleaned them, gave every tweet a topic with AI that I tested against my own answers, and built a Power BI report that ranks what to fix first.
- 14,375customer tweets analysed
- 91.7%AI topics matching my own answers (κ 0.90)
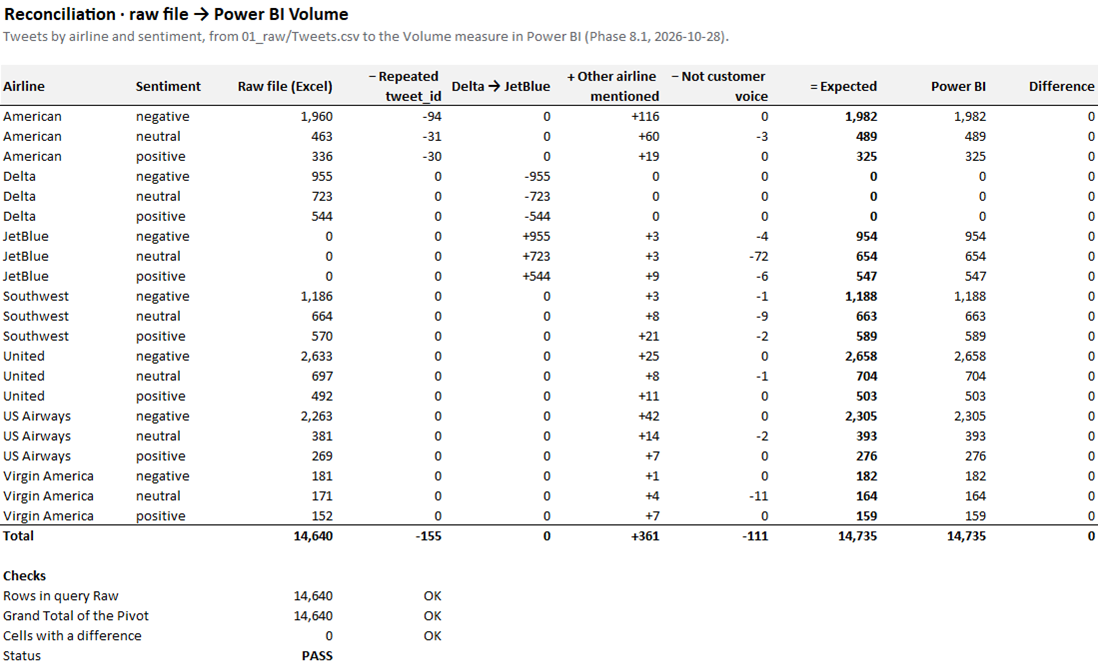
- 21 of 21airline × sentiment counts that match the raw file
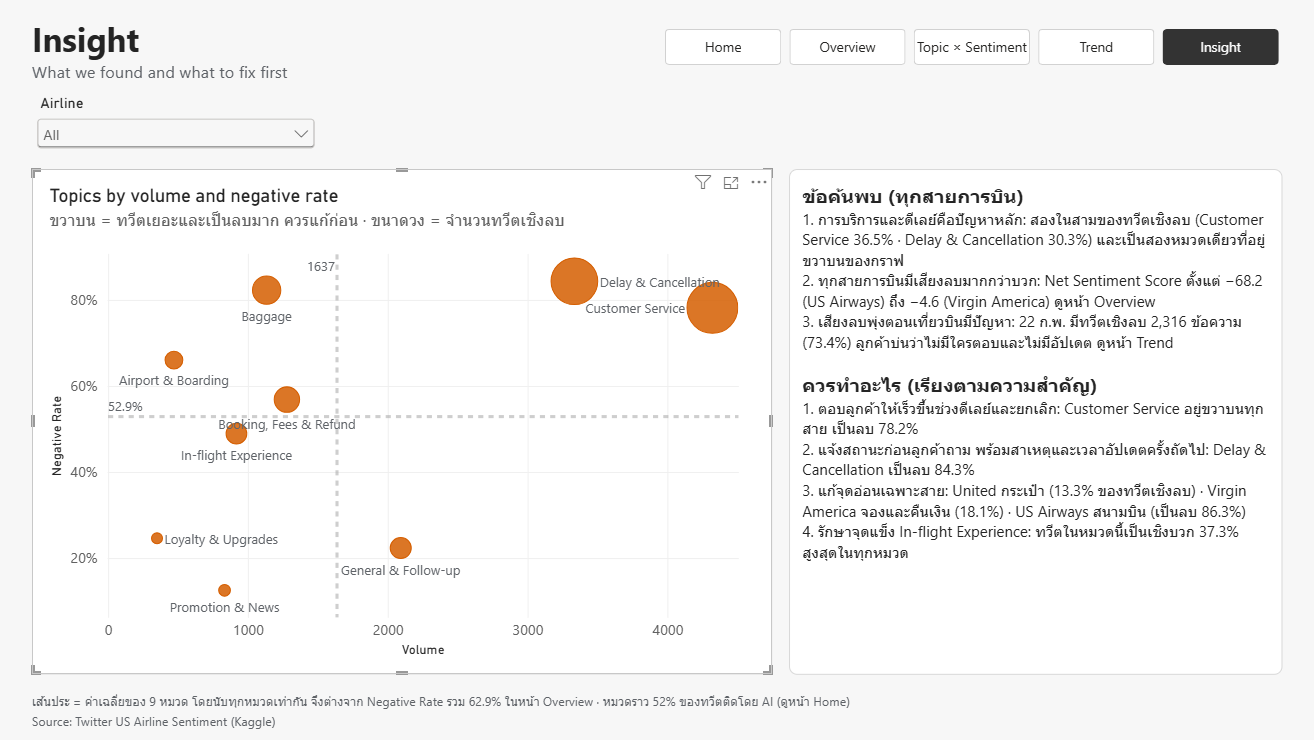
- 2 of 3negative tweets are about service or delays
Case study
- Question
- Which problems should an airline's customer team fix first, and which airline has the most to fix?
- Data
- Twitter US Airline Sentiment (Kaggle, CC BY-NC-SA 4.0): 14,640 tweets to six US airlines, 16–24 February 2015, with sentiment labelled by people. Passenger numbers from the US Bureau of Transportation Statistics.
- Method
- Checked and cleaned the data in Power Query, gave every tweet one of 9 topics, built a star schema and DAX measures, checked every number against the raw file, then answered seven business questions.
- What I found
- Customer service and delays make up two thirds of negative tweets. Every airline draws more negative than positive tweets, and negative tweets spike when flights go wrong.
- Recommendation
- Answer customers faster during disruption, send delay updates before customers ask, then fix each airline's own weak spot.
The problem
An airline's customer experience team wants to know what customers say about it and its rivals on Twitter, which problems to fix first, and when complaints spike. I wrote the report for two readers: an executive who needs one page, and a team lead who needs to see the tweets behind each number.
Before touching the data, I wrote down seven business questions, the metrics that answer them, and three hypotheses about what I expected to find, each with a rule for when the data supports it. That way the conclusions come from the data, not from a story picked afterwards.
How I did it
1Checked the data before fixing it
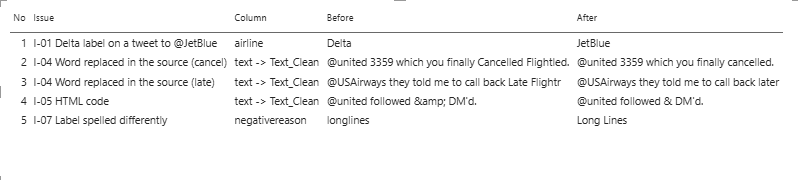
I profiled every column and logged 13 issues with the number of rows each one affects. The biggest: 2,218 of the 2,222 tweets labelled Delta are addressed to JetBlue, so that label is really JetBlue. 155 tweet IDs appear twice, 16 and 24 February are partial days, and a few accounts are news bots, not customers.
2Cleaned it so anyone can repeat it
Every fix is a Power Query step named after the issue it solves, and the raw file is never edited. Every row is accounted for: 14,640 rows less 155 repeats leaves 14,485 tweets; 361 rows are added for other airlines a tweet mentions; 110 tweets that are not customer voice stay in the data but are not counted.
3Gave every tweet a topic
The data has reasons only for complaints. I wrote a codebook of 9 topics, mapped the reasons people gave, and had AI label the rest. On a set of 363 tweets I labelled myself, the AI agreed only 49% of the time, so I rewrote where each topic starts and ends. On a fresh set of 362 tweets, agreement rose to 91.7%.
| Codebook | Tweets I labelled | AI agreed | Cohen's kappa |
|---|---|---|---|
| Version 1 | 363 | 49.0% | 0.29 |
| Version 2 | 362 | 91.7% | 0.90 |
4Compared airlines fairly
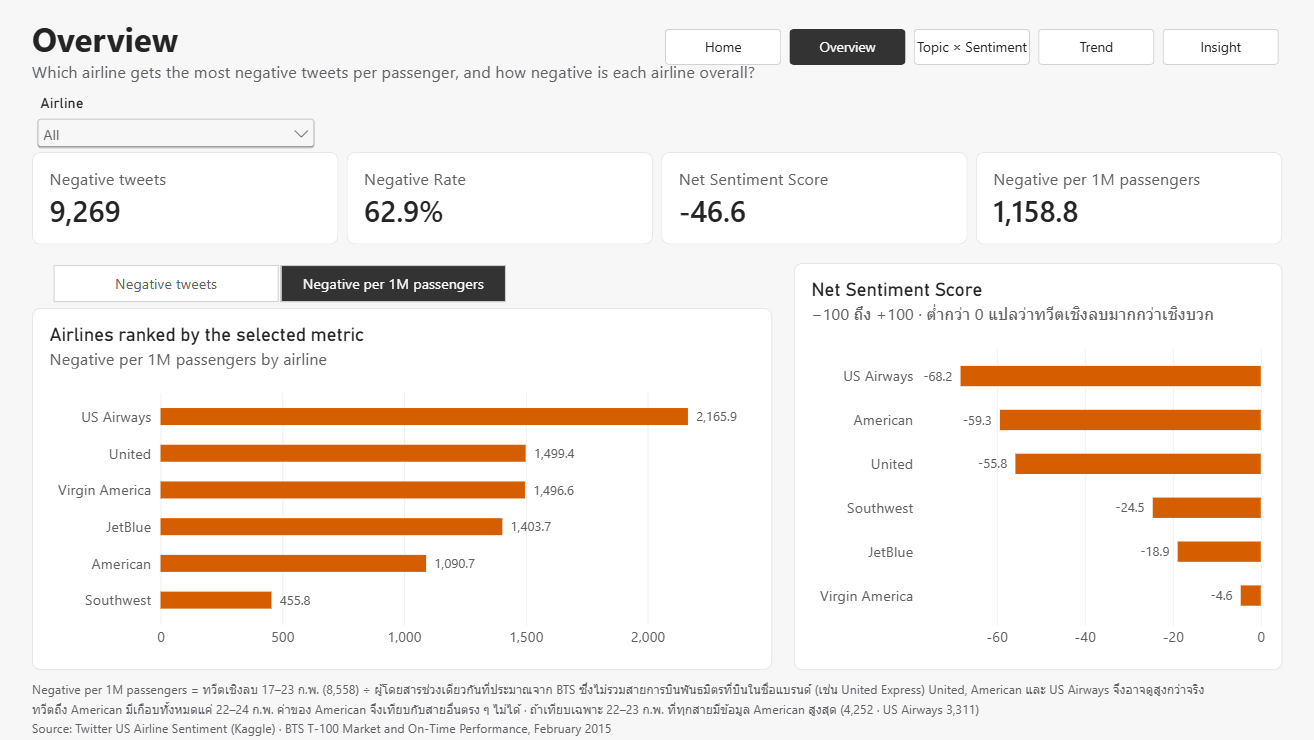
Bigger airlines get more tweets because they fly more people. I estimated each airline's passengers for the same 7 full days from US government data and compared negative tweets per 1 million passengers.
5Built the model and the report
A star schema with one fact table of 14,846 tweet × airline rows and dimensions for airline, date and topic. I checked every DAX measure against counts made outside Power BI before building any page. The report has five pages, Home, Overview, Topic × Sentiment, Trend and Insight, and a right-click on any number opens the tweets behind it.
6Checked everything before sharing
I traced every airline × sentiment count from the raw file to the report, and all 21 match. I read the 941 tweets a reviewer can see without scrolling and fixed 102 of them, had AI relabel 1,047 tweets whose original reasons were often wrong, and tested whether the rankings change when the labels change. The top two problems hold in every test.
Selected DAX
Four measures carry the report's logic. Formatted with DAX Formatter.
Volume
One rule decides what counts as customer voice: rows with an exclusion reason (news and bot accounts, airline replies, tweets to Delta) stay in the model but are never counted, so no row is deleted.
Volume =
CALCULATE ( COUNTROWS ( Fact_Tweets ), ISBLANK ( Fact_Tweets[Exclude_Reason] ) )
Negative per 1M Passengers
Compares airlines fairly: negative tweets on the 7 full days divided by passengers estimated for the same days, so the two partial days don't distort it.
Negative per 1M Passengers =
DIVIDE (
    CALCULATE ( [Negative], Dim_Date[Is_Partial_Day] = FALSE () ),
    SUM ( Dim_Brand[Passengers_17_23Feb] )
) * 1000000
Topic Share
Each topic's share within whatever is filtered (an airline, a sentiment): REMOVEFILTERS on the topic table gives the denominator, and + 0 shows a topic with no tweets as 0% instead of a blank.
Topic Share =
DIVIDE ( [Volume] + 0, CALCULATE ( [Volume], REMOVEFILTERS ( Dim_Topic ) ) )
QA Primary Check
A data-quality test in DAX: it counts tweets that do not have exactly one primary airline row, and the QA page shows 0.
QA Primary Check =
COUNTROWS (
    FILTER (
        VALUES ( Fact_Tweets[tweet_id] ),
        CALCULATE ( COUNTROWS ( Fact_Tweets ), Fact_Tweets[Is_Primary] = TRUE () ) <> 1
    )
) + 0
How I worked with AI
AI did the work that is repetitive and slow. I made the decisions and checked every result.
- AI (Claude) labelled the tweets that had no topic, coded the other airlines in multi-airline tweets, and drafted documents for me to approve.
- Every AI result has a number behind it: agreement with my own labels, or a match with an independent count.
- The Python scripts used for those checks were written by AI. I checked their output against Power BI and Excel.
- I decided the topics, the fixes, what counts as customer voice, and the recommendations.
What I found
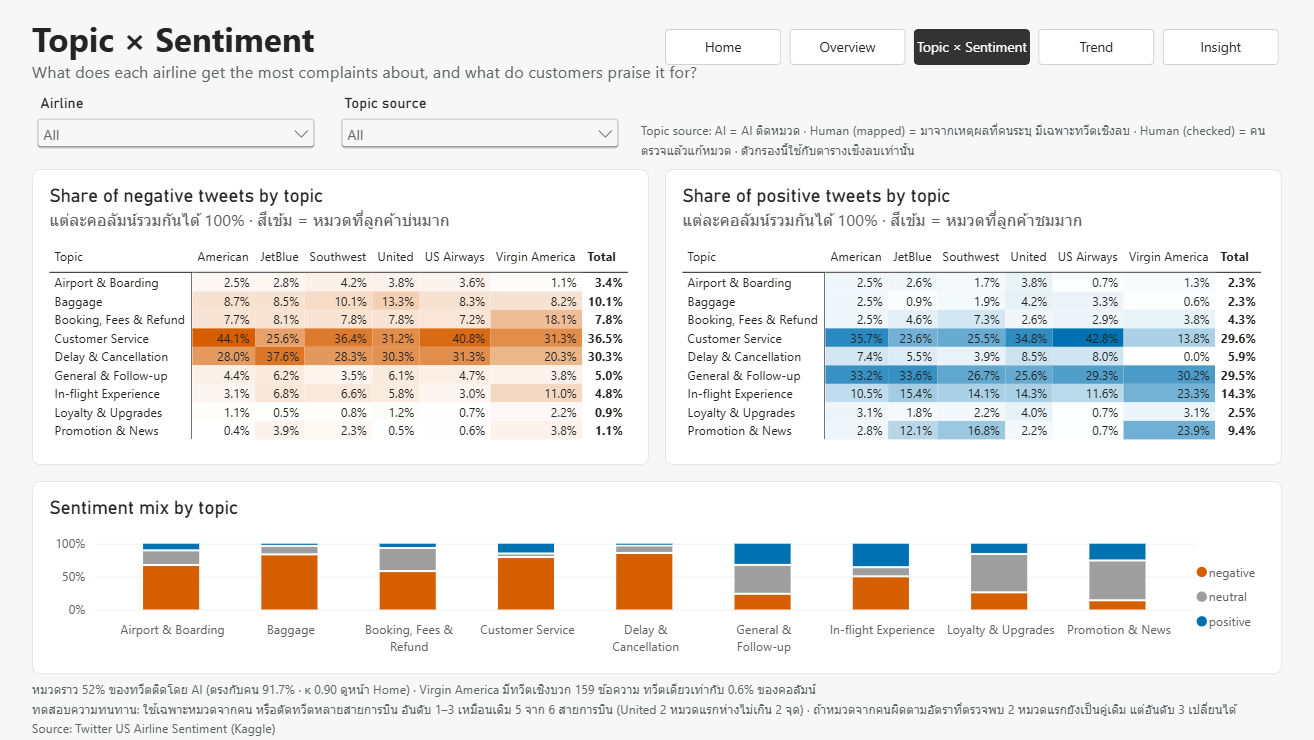
- Service and delays drive the complaints. Customer Service and Delay & Cancellation make up two thirds of negative tweets (36.5% and 30.3%), and they are the only topics that are both frequent and mostly negative (78.2% and 84.3%).
- Every airline draws more negative than positive tweets. Net Sentiment Score runs from −68.2 (US Airways) to −4.6 (Virgin America). Among airlines with data on all 7 days, US Airways gets the most negative tweets per passenger (2,165.9 per 1M).
- Negative tweets spike when flights go wrong. Sunday 22 February had 2,316 negative tweets (73.4%). Customers say no one responds, delays come without updates, and they doubt weather explanations.
The three hypotheses I wrote before the analysis:
| What I expected | Result |
|---|---|
| The top complaint is delays or baggage | Not supported: customer service comes first (36.5% against 30.3%) |
| Low-cost and large airlines get the same complaints | Supported: the same top three, in the same order |
| The most praised topic is service or in-flight comfort | Supported, narrowly: customer service leads general thanks by 3 tweets |
What I recommend
- Answer customers faster when flights are delayed or cancelled.
- Send delay and cancellation updates before customers ask, with the cause and the time of the next update.
- Fix each airline's own weak spot: baggage at United (13.3% of its negative tweets), booking and refunds at Virgin America (18.1%), the airport process at US Airways (86.3% negative).
- Protect in-flight experience, the topic with the highest share of positive tweets (37.3%).
Limits
- 9 days of February 2015, collected by an unknown method: read the results as a pattern, not a full-year picture.
- Tweets to American exist almost only on 22–24 February, so American cannot be compared directly with the others.
- About half the topics come from AI. Under testing the top two problems hold, but third place can change.
- Passenger numbers are estimates and leave out regional partner flights.
Files
- Power BI report (.pbix, 2.9 MB)
- Executive brief: English · Thai (PDF)
- Working documents (Excel: issue log, data dictionary, decision log and more) · Topic codebook (Excel)
- Source files to refresh the report (zip, 1.3 MB)
- README: how to open and refresh